
Power BI Development
Interactive Power BI dashboards and data models that unlock real business insight.
Discuss your requirements
'%20transform='translate(.587%204.468)%20scale(.91904)'/%3e%3cpath%20d='M97.28%2081.607H37.987a2.743%202.743%200%2000-1.874%204.751l38.1%2035.562a5.991%205.991%200%20004.087%201.61h33.574z'%20fill='%230078d4'/%3e%3cpath%20d='M46.09.002A6.434%206.434%200%200039.93%204.5L.644%20120.897a6.469%206.469%200%20006.106%208.653h32.48a6.942%206.942%200%20005.328-4.531l7.834-23.089%2027.985%2026.101a6.618%206.618%200%20004.165%201.519h36.396l-15.963-45.616-46.533.011L86.922.002z'%20fill='url(%23azure-original-b)'%20transform='translate(.587%204.468)%20scale(.91904)'/%3e%3cpath%20d='M98.055%204.408A6.476%206.476%200%200091.917.002H46.575a6.478%206.478%200%20016.137%204.406l39.35%20116.594a6.476%206.476%200%2001-6.137%208.55h45.344a6.48%206.48%200%20006.136-8.55z'%20fill='url(%23azure-original-c)'%20transform='translate(.587%204.468)%20scale(.91904)'/%3e%3c/svg%3e)
'%3e%3cstop%20offset='0'%20stop-color='%235A9FD4'/%3e%3cstop%20offset='1'%20stop-color='%23306998'/%3e%3c/linearGradient%3e%3clinearGradient%20id='python-original-b'%20gradientUnits='userSpaceOnUse'%20x1='209.474'%20y1='1098.811'%20x2='173.62'%20y2='1149.537'%20gradientTransform='matrix(.563%200%200%20-.568%20-29.215%20707.817)'%3e%3cstop%20offset='0'%20stop-color='%23FFD43B'/%3e%3cstop%20offset='1'%20stop-color='%23FFE873'/%3e%3c/linearGradient%3e%3cpath%20fill='url(%23python-original-a)'%20d='M63.391%201.988c-4.222.02-8.252.379-11.8%201.007-10.45%201.846-12.346%205.71-12.346%2012.837v9.411h24.693v3.137H29.977c-7.176%200-13.46%204.313-15.426%2012.521-2.268%209.405-2.368%2015.275%200%2025.096%201.755%207.311%205.947%2012.519%2013.124%2012.519h8.491V67.234c0-8.151%207.051-15.34%2015.426-15.34h24.665c6.866%200%2012.346-5.654%2012.346-12.548V15.833c0-6.693-5.646-11.72-12.346-12.837-4.244-.706-8.645-1.027-12.866-1.008zM50.037%209.557c2.55%200%204.634%202.117%204.634%204.721%200%202.593-2.083%204.69-4.634%204.69-2.56%200-4.633-2.097-4.633-4.69-.001-2.604%202.073-4.721%204.633-4.721z'%20transform='translate(0%2010.26)'/%3e%3cpath%20fill='url(%23python-original-b)'%20d='M91.682%2028.38v10.966c0%208.5-7.208%2015.655-15.426%2015.655H51.591c-6.756%200-12.346%205.783-12.346%2012.549v23.515c0%206.691%205.818%2010.628%2012.346%2012.547%207.816%202.297%2015.312%202.713%2024.665%200%206.216-1.801%2012.346-5.423%2012.346-12.547v-9.412H63.938v-3.138h37.012c7.176%200%209.852-5.005%2012.348-12.519%202.578-7.735%202.467-15.174%200-25.096-1.774-7.145-5.161-12.521-12.348-12.521h-9.268zM77.809%2087.927c2.561%200%204.634%202.097%204.634%204.692%200%202.602-2.074%204.719-4.634%204.719-2.55%200-4.633-2.117-4.633-4.719%200-2.595%202.083-4.692%204.633-4.692z'%20transform='translate(0%2010.26)'/%3e%3cradialGradient%20id='python-original-c'%20cx='1825.678'%20cy='444.45'%20r='26.743'%20gradientTransform='matrix(0%20-.24%20-1.055%200%20532.979%20557.576)'%20gradientUnits='userSpaceOnUse'%3e%3cstop%20offset='0'%20stop-color='%23B8B8B8'%20stop-opacity='.498'/%3e%3cstop%20offset='1'%20stop-color='%237F7F7F'%20stop-opacity='0'/%3e%3c/radialGradient%3e%3cpath%20opacity='.444'%20fill='url(%23python-original-c)'%20d='M97.309%20119.597c0%203.543-14.816%206.416-33.091%206.416-18.276%200-33.092-2.873-33.092-6.416%200-3.544%2014.815-6.417%2033.092-6.417%2018.275%200%2033.091%202.872%2033.091%206.417z'/%3e%3c/svg%3e)
'%20gradientUnits='userSpaceOnUse'%3e%3cstop%20offset='0'%20stop-color='%23cbced0'/%3e%3cstop%20offset='1'%20stop-color='%2384838b'/%3e%3c/linearGradient%3e%3clinearGradient%20id='b'%20x1='301.03'%20x2='703.07'%20y1='151.4'%20y2='553.44'%20gradientTransform='matrix(.17572%200%200%20.17931%20-.16%2014.112)'%20gradientUnits='userSpaceOnUse'%3e%3cstop%20offset='0'%20stop-color='%23276dc3'/%3e%3cstop%20offset='1'%20stop-color='%23165caa'/%3e%3c/linearGradient%3e%3c/defs%3e%3cpath%20fill='url(%23a)'%20fill-rule='evenodd'%20d='M64%20100.38c-35.346%200-64-19.19-64-42.863%200-23.672%2028.654-42.863%2064-42.863s64%2019.19%2064%2042.863c0%2023.672-28.654%2042.863-64%2042.863zm9.796-68.967c-26.866%200-48.646%2013.119-48.646%2029.303%200%2016.183%2021.78%2029.303%2048.646%2029.303s46.693-8.97%2046.693-29.303c0-20.327-19.827-29.303-46.693-29.303z'/%3e%3cpath%20fill='url(%23b)'%20fill-rule='evenodd'%20d='M97.469%2081.033s3.874%201.169%206.124%202.308c.78.395%202.132%201.183%203.106%202.219a8.388%208.388%200%200%201%201.42%202.04l15.266%2025.74-24.674.01-11.537-21.666s-2.363-4.06-3.817-5.237c-1.213-.982-1.73-1.331-2.929-1.331h-5.862l.004%2028.219-21.833.009V41.26h43.844s19.97.36%2019.97%2019.359c0%2018.999-19.082%2020.413-19.082%2020.413zm-9.497-24.137-13.218-.009-.006%2012.258%2013.224-.005s6.124-.019%206.124-6.235c0-6.34-6.124-6.009-6.124-6.009z'/%3e%3c/svg%3e)
About Power BI Development
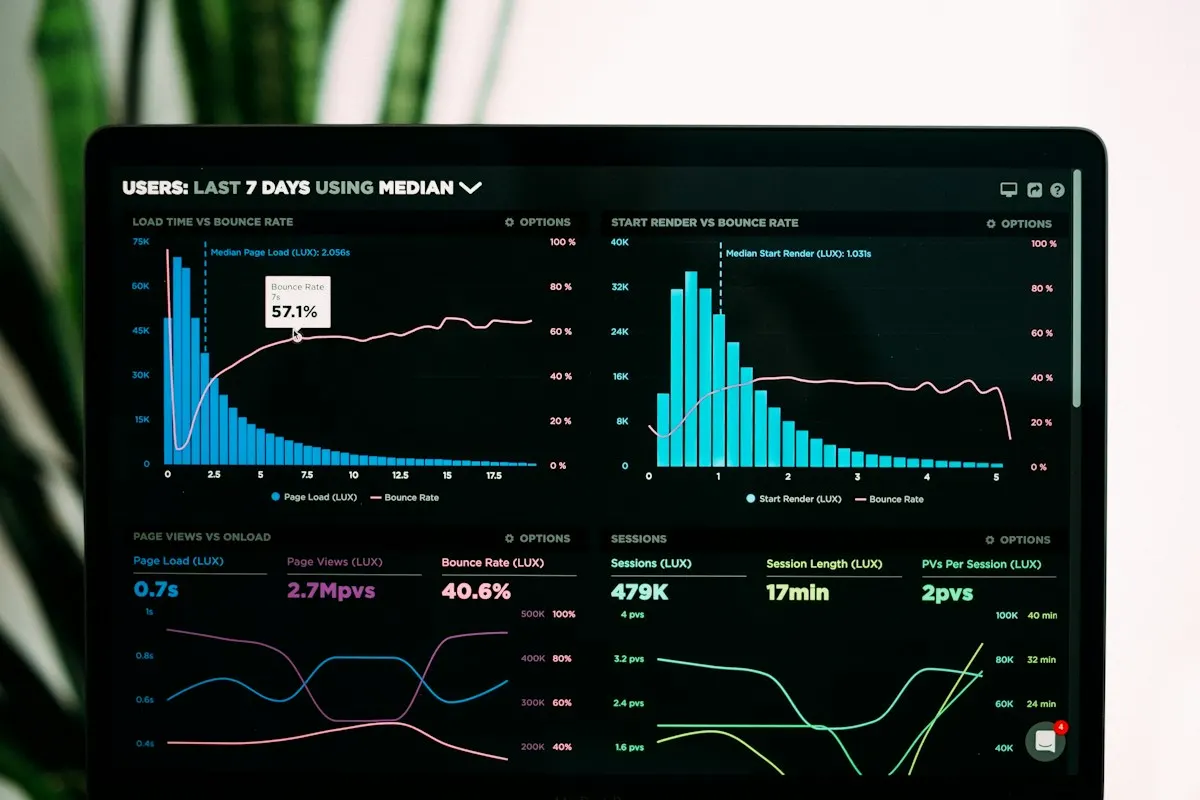
VinayakClouds delivers powerful data visualization and business analytics solutions using Microsoft Power BI. Our Power BI developers create interactive dashboards, automated reports, and embedded analytics that turn complex data into clear, actionable insights.
We design Power BI solutions from the ground up — starting with data source assessment, data modeling, DAX measure creation, and visualization design. Our dashboards connect to multiple data sources including SQL databases, Excel, APIs, cloud services, and streaming data.
Our data modeling expertise ensures efficient, scalable Power BI models. We implement star schemas, calculated columns, measures, and relationships that enable fast querying across millions of rows. Row-level security ensures users only see data relevant to their role.
Custom visuals extend Power BI's capabilities beyond standard charts. We develop custom D3.js-based visuals, integrate R and Python scripts for advanced analytics, and implement drill-through navigation for exploring data at multiple levels of detail.
Power BI embedded analytics bring insights directly into your applications. We integrate Power BI reports into web apps, SharePoint sites, and Microsoft Teams, providing contextual analytics where your team already works. Embedded solutions include proper authentication and row-level security.
Automated data refresh, scheduled report distribution, and alert configurations ensure stakeholders always have access to the latest information. We also provide training and documentation so your team can create and modify reports independently.
Key Features
Everything you need for a successful project.
Custom Dashboards
Interactive dashboards for real-time insights.
Data Modeling
Complex data models with DAX formulas.
Report Automation
Scheduled report generation and distribution.
Embedded Analytics
Power BI Embedded in your applications.
Data Connectors
Connect 100+ data sources seamlessly.
Row-Level Security
Data access control by user roles.
Your Advantages
Data-Driven
Make informed business decisions.
Real-time
Live data updates and monitoring.
Self-Service
Users can explore data independently.
Accessible
Access dashboards from any device.
Technologies We Use
SQL ServerAzure SynapsePythonRHow We Deliver
Data Assessment
Understand data sources and KPIs.
Data Modeling
Design efficient data models.
Visualization
Create interactive dashboards.
Deployment
Publish and configure access.
Ready to Get Started?
Bring us your business context. We will help define a considered path from your requirements to a maintainable solution.